R Markdown
This is an R Markdown document. Markdown is a simple formatting syntax for authoring HTML, PDF, and MS Word documents. For more details on using R Markdown see http://rmarkdown.rstudio.com.
A few useful syntax are shown below in the post:
1. You can embed an R code chunk like this:
summary(cars)
## speed dist
## Min. : 4.0 Min. : 2.00
## 1st Qu.:12.0 1st Qu.: 26.00
## Median :15.0 Median : 36.00
## Mean :15.4 Mean : 42.98
## 3rd Qu.:19.0 3rd Qu.: 56.00
## Max. :25.0 Max. :120.00
fit <- lm(dist ~ speed, data = cars)
fit
##
## Call:
## lm(formula = dist ~ speed, data = cars)
##
## Coefficients:
## (Intercept) speed
## -17.579 3.9322. Including Plots
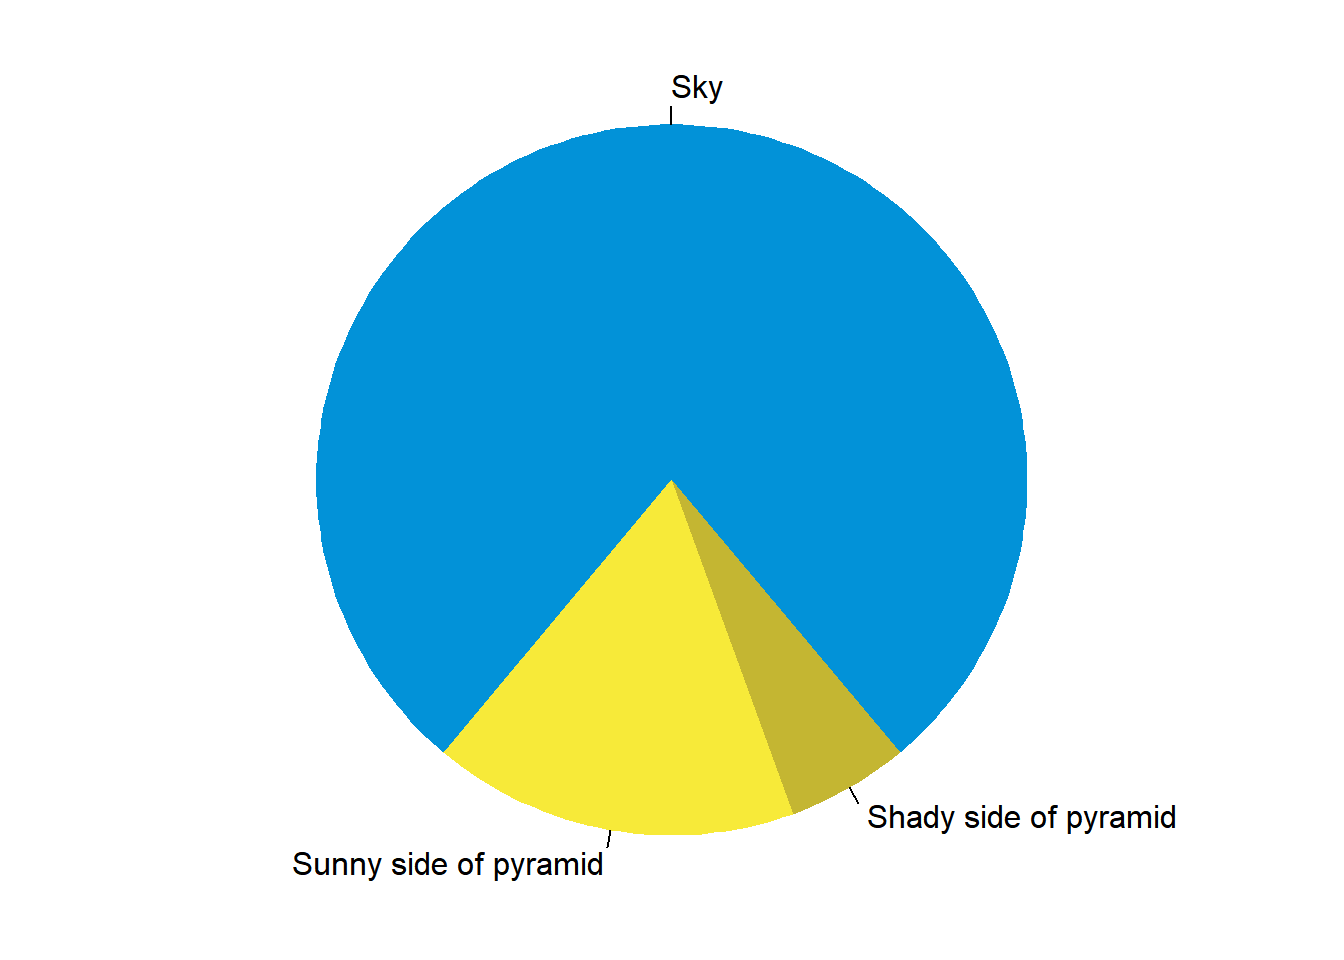
You can also embed plots. See Figure 1 for example:
par(mar = c(0, 1, 0, 1))
pie(
c(280, 60, 20),
c('Sky', 'Sunny side of pyramid', 'Shady side of pyramid'),
col = c('#0292D8', '#F7EA39', '#C4B632'),
init.angle = -50, border = NA
)
Figure 1: A fancy pie chart.
- Referencing a image/figure.
# Define the tag after lagnuage notation such as `pie`
{r pie, fig.cap='A fancy pie chart.', tidy=FALSE}
Use \@ref(fig:pie) to refrence an image. 3. Inline R Code
There were `r nrow(cars)` cars studiedThere were 50 cars studied.
4. Use links in Rmarkdown
Use a plain http address or add a link to a phrase:
you can also use use a snippet predefined for Rmd file link (Shfit + Tab) to create a link.
5. Use local images or image URLs.

6. Tables in R markdown
- Insert table use
knitr::kable()function. Applicable for any 2D rectangular data(Data Frame, Matrix, etc.).
knitr::kable(head(iris[, 1:3]), "pipe")| Sepal.Length | Sepal.Width | Petal.Length |
|---|---|---|
| 5.1 | 3.5 | 1.4 |
| 4.9 | 3.0 | 1.4 |
| 4.7 | 3.2 | 1.3 |
| 4.6 | 3.1 | 1.5 |
| 5.0 | 3.6 | 1.4 |
| 5.4 | 3.9 | 1.7 |
- Or create table with traditional markdown way.
| mpg | cyl | disp | hp | |
|---|---|---|---|---|
| Mazda RX4 | 21.0 | 6 | 160 | 110 |
| Mazda RX4 Wag | 21.0 | 6 | 160 | 110 |
| Datsun 710 | 22.8 | 4 | 108 | 93 |
| Hornet 4 Drive | 21.4 | 6 | 258 | 110 |
| Hornet Sportabout | 18.7 | 8 | 360 | 175 |
| Valiant | 18.1 | 6 | 225 | 105 |
7. LaTeX Equations
- Inline equation:
$equation$
- Display equation:
$$equation$$
8. Sub/Super scripts and others
superscript^2^
subscript~2~
~~strikethrough~~
<mark>This is a highlighted text</mark>superscript2
subscript2
strikethrough
This is a highlighted text
9. Use Bibliography
Citation in sentence @R-base or after the sentence [@casella2002statistical]
and one more [-@king1974nonoperative]Citation in sentence Brutsaert (2005) or after the sentence (Brath and Jonker 2015) and one more (2022)
This will automatically add the bibliography at the end of the documents. For more information see this
Reference
This is a footnote text; see in the bottom of the page.↩︎